Showing posts with label liberalism. Show all posts

Thursday, February 26, 2015

Liberal Bias

A group of conservative psychologists headed by John Chambers has been fighting back against what they perceive as a liberal bias among social psychologists. Their latest paper demonstrates some systematic errors in assessing social mobility in the United States, with liberals making greater errors than conservatives. The authors refer to these errors as “distorted along ideological lines.”

Social mobility refers to the upward or downward movement of individuals between social classes. It is usually measured by comparing different generations within the same family, called intergenerational mobility. If the United States were a land of great economic opportunity, there would be only a modest relationship between people's wealth and that of their parents. However, studies have shown that there is less social mobility in this country than in most other industrial democracies.

Until recently, most scholars believed that social mobility in this country had declined in the last few decades. This was an inference based on the well-established fact that income inequality has increased dramatically since 1980. Since it is known that countries with the greatest inequality have the lowest social mobility, it was presumed that social mobility had been declining as well. However, in 2014, a research group led by Raj Chetty published an extensive study of the intergenerational mobility of Americans born between 1971 and 1993 using income tax data. They found that social mobility has been relatively constant over the time period covered by the study. The authors note that much of the increase in inequality has occurred at the extreme upper end (“the 1%”), which doesn't have much effect on social mobility. 

Chambers and his colleagues did an internet survey of 410 American adults in which they were asked to estimate what percentage of Americans born in the early 1980s whose parents were in the top, middle and lower thirds of the income distribution had migrated to each of the other two thirds of the distribution by the time they were in their late twenties. The accuracy of their estimates was measured against the Chetty, et al., data. They were also asked to indicate, on a 5-point scale, whether they thought social mobility had increased, decreased or stayed the same over the past 40 years. Finally, they were asked to state their political idelogy on a 5-point scale running from “strongly liberal” to “strongly conservative.” 

Here are the main findings (which were replicated in a followup study):
  • Most respondents thought there was less social mobility than had actually occurred. Although all three groups underestimated social mobility, liberals underestimated it more than moderates and conservatives did. With regard to people whose parents were in the middle class, liberals underestimated the percentage that were upwardly mobile, while conservatives underestimated the percentage that were downwardly mobile. These findings are illustrated in this chart.
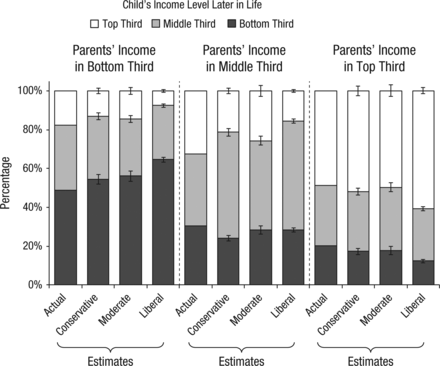

  • The majority (56%) thought that social mobility had declined over the past 40 years, with only 15% answering correctly that it was stable. While the majority in all three groups thought mobility had declined, a higher percentage of liberals gave this incorrect response than moderates or conservatives.
The behavior of the liberals in this study exhibits motivated reasoning. They tend to believe what their ideology tells them, even though in this case it isn't true. Their errors were consistent with the liberal critique of this country that it does not permit enough social mobility. (Conservatives were also guilty of motivated reasoning when the underestimated the percentage of middle class people who were downwardly mobile.)

Some social psychologists and journalists have stated or implied that politically motivated reasoning is more prevalent among conservatives than liberals—the assymetry thesis. Chambers and his colleagues rightly point out that their results contradict the assymetry thesis. It is likely that all people engage in motivated reasoning, the size and direction of their errors depending on the issue at hand. Since liberals favor progressive change while conservatives value the status quo, liberals may exaggerate the seriousness of current problems, such as limited social mobility. Chambers is free to call this “distortion” as long as he applies a similar label to the errors of conservatives.

(Note to researchers: If you want to find “distortion,” it's probably best to present participants with a cognitive task similar to the one used by Chambers—a task that is unfamiliar, and for which everyday life provides little help in arriving at a correct answer.)

Let me tell you what is not the intended take-home message of this post. Just because the public underestimates the amount of social mobility in this country, that does not mean that the current situation is satisfactory. The Horatio Alger myth is still a myth. Miles Corak demonstrated in 2006 that social mobility in the U.S. is substantially lower than in Canada and seven of the eight European countries in the study. Only the U.K. has a (slightly) more rigidly stratified society than the U.S. As one pundit suggested, if you want to live the American dream, move to Finland. Social mobility also varies dramatically by region with the U.S., with mobility being lowest in the southeastern states. (See this PBS interview of Raj Chetty.) Emmanuel Saez, one of the co-authors of the Chetty study, put it this way: “The level of opportunity is alarming, even though it's stable over time.”


Furthermore, the fact that inequality is increasing means that low social mobility has more serious consequences. As the rungs of the economic ladder move further apart, the economic penalty paid by those who are stuck in the middle and lower classes becomes greater. Quoting Saez again, “The consequences of the 'birth lottery'—the parents to whom a child is born—are larger today than in the past.”

You may also be interested in reading:

In Denial

Herding Cats

Is Democracy Possible?  Appendix

Thursday, December 5, 2013

Herding Cats

You've all heard that trying to get liberals united behind a common goal is like herding cats, or that when liberals go into battle, they form a circular firing squad. A new study appears to support these clichés, and attributes the problem to a liberal personality trait, the need for uniqueness.

The false consensus effect is a cognitive error in which we believe that more people agree with our attitudes than is actually the case. For example, both those who favor and those who oppose the legalization of marijuana might think that theirs is the majority view. One explanation for false consensus is that we tend to associate with others who share our views and are therefore exposed to a biased sample of opinions. The opposite of false consensus is a false uniqueness effect in which people incorrectly believe that most others disagree with them. However, most studies of the general population find false consensus rather than false uniqueness.

In the study by Chadly Stern and others, 292 participants recruited over the internet were asked their opinions on 41 topics, 22 non-political and 19 political. They were asked to classify themselves as liberal, moderate or conservative. Then they were asked to estimate the percentage of people participating in the study “who share your political beliefs” who agreed with them on each item. A true measure of false consensus or uniqueness was obtained by comparing the participants' estimates to the actual beliefs of the study participants in their political in-group.

It was found that all three groups were inaccurate. Both moderates and conservatives showed the usual false consensus effect, but liberals showed false uniqueness. They underestimated the percentage of fellow liberals who agreed with them. In a second study, 287 participants were this time asked to estimate the percentage of people who shared their political beliefs in the American population who agreed with them on each item. The same results were obtained.


The authors proposed an explanation for the false uniqueness effect among liberals: That they are higher on a personality trait called need for uniqueness, defined as a strong dispositional desire to feel unique. The authors used 11 items from this 34-item Need for Uniqueness Scale, but I'm not sure which ones. Liberals are indeed higher than moderates and conservatives in need for uniqueness. An analysis showed that the relationship between political ideology and overestimation of consensus was mediated by need for uniqueness, meaning that the correlation between ideology and overestimation was significantly reduced when the effect of their common relationship to need for uniqueness was statistically removed.

I have some concerns about this study. For example, I'm not sure how participants interpreted the phrase “people who share your political beliefs.” It would have been better if the instructions had specifically referred to fellow liberals, moderates or conservatives. There are good reasons to expect liberals to underestimate the percentage of people in the general population who agree with them. As Justin Lewis has demonstrated, the corporate media tend to exclude progressive opinions from public debate, leading liberals to feel outside the political mainstream. For example, the media continually identify support for modest cuts in Social Security and Medicare as the centrist political position when their own polls show that the public is overwhelmingly opposed to such cuts. If the participants in the Stern study were confused about the group whose attitudes they were estimating, this could partially explain the results. Liberals have been marginalized by the corporate media.

I am also unimpressed with the attempt to explain liberals' behavior as resulting from a need for uniqueness. In my opinion, the words “need” and “uniqueness” are both overstatements. The items in the scale largely reflect the respondent's willingness to engage in nonconforming behavior. All the data in this study are correlational, not causal. The apparent "need" for uniqueness could be as much a result of the illusion of uniqueness as its cause. In any case, the relationship between ideology and overestimation of consensus appears to still be statistically significant after the effect of need for uniqueness is removed, so it's not a complete explanation for the phenomenon.

In the article, the authors contrast the Occupy Movement to the Tea Party. They note that the Tea Party became a potent political force, while they claim the Occupy Movement broke down due to internal bickering, presumably a result of their individual needs to feel unique. This ignores a far more important reason for the Tea Party's greater success. They received behind-the-scenes financial and logistical support from wealthy conservatives and were welcomed into the Republican Party. The Occupy Movement, on the other hand, received almost no outside support, and was shunned by the Democrats, who chose to side instead with their wealthy political donors, mostly members of the 1%.  To attribute the failure of the Occupy Movement to the personalities of its members is politically naive. One of my pet peeves is the tendency for psychologists—even social psychologists, who should know better—to attribute behavior primarily to personal motives and overlook situational forces that are much more likely explanations for the behavior.

Regardless of why liberals underestimate their political strength, it is important that they examine public opinion polls directly, rather than trusting the corporate media to interpret them. (See, for example, my recent post on the public's “surprising” views on climate change.)

Friday, October 18, 2013

Is Democracy Possible? Appendix

To make sense of this post, you must first read Part 1 and Part 2.

Kahan and his colleagues did not discuss differences between the responses of liberals and conservatives to his four contingency problems, in spite of the fact that political ideology interacted with his other variables in a way that was statistically significant.

The asymmetry thesis, most strongly identified with journalist Chris Mooney, states that politically motivated reasoning is greater among conservatives than among liberals. Social psychologist John Jost and his colleagues present evidence that conservatism is more strongly correlated with measures of dogmatism and resistance to change than liberalism.

There is evidence of ideological asymmetry in the Kahan experiment. Here it is:

Table 5
These curves represent the distributions of the responses in each condition. The high point of each distribution is the mean. To help us keep these findings straight, Kahan has drawn the liberals in blue and the conservatives in red. The top two figures are of little interest. They merely show that liberals and conservatives are equally likely to answer the questions about the skin cream incorrectly.

However, the bottom two graphs show ideological polarization. Specifically, the conservatives are more likely than the liberals to answer the question correctly when the correct answer corresponds with their expectations, and they are more likely than the liberals to answer incorrectly when the correct answer conflict with their ideology. This is true of both the low numeracy participants (on the left) and the high numeracy participants (on the right). Stated simply, the two red distributions are farther apart than the two blue ones.

Of course, since this study involves only a single issue, another way of interpreting these data is that conservatives care more about gun control than liberals do.

Table 6
You can also see this ideological asymmetry in the bottom figure of Table 3, repeated above, where, at most levels of numeracy, the two red lines are farther apart than the two blue lines. In a blog post, Kahan acknowledges this evidence of asymmetry, but contends that it less interesting than the fact that both liberals and conservatives show confirmatory bias at high levels of numeracy. He points out that the greatest evidence of asymmetry occurs at low to moderate levels of numeracy (inside the solid circle). At the very highest levels of numeracy (inside the broken circle), the two conservative groups appear to be converging, while the two liberal groups are diverging.

He's right about that. Committed liberals must acknowledge the disappointing performance of the highly numerate liberals. The only reasonable explanation is that bright, highly educated liberals are biased too. But that doesn't change the fact that, in this experiment, conservatives show more evidence of ideological bias than liberals do.

You may also be interested in reading:


Wednesday, October 16, 2013

Is Democracy Possible? Part 2

You must read Part 1 before continuing or none of this will make sense.

A study was conducted by Dan Kahan of Yale University and three colleagues involving a demographically representative sample of 1111 American adults recruited by Polimetrix/YouGov, an online survey research firm. Preliminary questions were used to categorize the participants along two dimensions:
  • Liberalism v. Conservatism: They rated themselves as very liberal to very conservative on a 5-point scale, and strong Democrat to strong Republican on a 7-point scale. These scales were combined, and the participants were divided at the midpoint into liberal Democrats and conservative Republicans.
  • Numeracy: Participants' numeracy was measured using nine real world mathematical problems. They received a numeracy score of 0 to 9.

Each participant was then asked to answer one of the four judgment of contingency problems shown in Table 2 of Part 1. These are labeled by the correct answer to the problem:
  • Rash increases: The rash got worse when the skin cream was used.
  • Rash decreases: The rash got better when the skin cream was used.
  • Crime increases: There was more crime with the ban on concealed weapons.
  • Crime decreases: The ban on concealed weapons reduced crime.
Table 3
The top graph presents the results for the skin cream questions. On the vertical dimension, the higher the line, the more people answered the question correctly. Horizontally, as you go from left to right, numeracy increases. The four groups all show almost the same results. As you would expect with content-neutral problems, as numeracy increases, more people answer correctly.

The bottom graph shows the results for the gun control questions. There is a tendency for scores to improve with numeracy, but the results are not uniform. The most striking trend is evidence of confirmatory bias. Participants are more likely to give the correct answer in the two conditions where it is consistent with their political views—the liberals when crime decreases and the conservatives when crime increases. When the correct conclusion is inconsistent with the participant's partisan ideology, the lines are almost flat, which means that the high numeracy people are not successfully correcting their biases. The numerate liberals claim that gun control is effective, even when the evidence shows it is not. The numerate conservatives claim that concealed weapons discourage crime, even when the evidence shows they do not. These labels may help to make the graph more clear.

Table 4
What is going on in the minds of these participants? It's likely that participants in all four groups initially engage in System 1 thinking. They look at the data and immediately believe what their political ideology leads them to expect. For the two groups in which the data are consistent with their prior beliefs, this is no problem. If they use System 2 to do the math, they will become more confident of the correct conclusion. But the two groups in which the data are inconsistent with their prior beliefs are faced with a conflict if they engage in System 2 thought. The results suggest that either they don't bother, or if they do, they manage to reinterpret the data in a way that confirms their expectations.

These data support the identity-protective cognition thesis rather than the science-comprehension thesis. It seems unlikely that additional math and science training would help these folks to draw the correct conclusion when that conclusion conflicts with their ideology. One commentator referred to these results as “the most depressing discovery about the brain, ever.” (Journalists have a depressing tendency to refer to the results of psychological research as discoveries about “the brain,” falsely implying that they are physiologically determined. I would say these results demonstrate the effectiveness of political socialization.) They are consistent with findings showing that giving people information which corrects common misconceptions sometimes backfires and causes them to believe them more strongly. It also supplements Kahan's previous finding that the most scientifically literate Americans are not more convinced that climate change is a serious threat, but are more ideologically polarized than those who are less scientifically literate.

Despite the fact that the authors proposed that such results would raise doubts about the possibility of rational self-government, they do not recommend that we curtail participatory democracy and turn over our more important decisions to Big Brother. Kahan sees the problem as a failure of scientific communication. He proposes that scientific issues be reframed so as to reaffirm the ideological beliefs of those who might otherwise be skeptical. For example, in another article he suggests that global warming be reframed as a technical problem to be address by corporations rather than a political problem to be addressed by government:

They [conservatives] would probably look at the evidence more favorably, however, if made aware that possible responses to climate change include nuclear power and geoengineering. . . Similarily, [liberals] are less likely to reflexively dismiss the safety of nanotechnology if they are made aware of the part that nanotechnology might play in environmental protection, and not just its usefulness in the manufacture of consumer goods.

Here is a video of Kahan discussing the results of his global warming studies and his suggestions for improving scientific communication.


Kahan seems to be suggesting that our ideological disagreements can be solved through clever marketing, but this seems an unlikely solution. For example, any serious attempt to curtail climate change through either nuclear power or geoengineering would encounter strong and well-founded objections from important members of the scientific community, and consensus would quickly disappear.

Before we throw up our hands in despair, Kahan's results need to be replicated with a broader range of issues. However, to be fair, global warming is such an important issue that failure to reach consensus on a solution will make all the other issues which we think we care about seem like the equivalent of rearranging the deck chairs on the Titanic.

However, there are some research findings that seem to offer greater hope of overcoming ideological polarization. I will discuss them in future posts. But first, for those that are interested, an appendix about the differences between liberals and conservatives.

You may also be interested in reading:


Monday, October 14, 2013

Is Democracy Possible? Part 1

Let's not be naïve. Obviously, the political system we have now is more a plutocracy than a democracy. Our government has been captured by corporations and the people who own them. But suppose, by some miracle, we were able to enact effective campaign reform laws and politicians became responsive to public opinion. Are American citizens capable of making rational decisions based on scientific information?

Before we go any further, please take a look at this problem.

Table 1
The problem requires correctly interpreting a contingency table. Even bright college students often get it wrong. When deciding whether the skin cream works, some people only compare the numbers in the top row—the number of people who used the skin cream who get better or worse. But this ignores important information from the control group that didn't take the skin cream. Other people only compare the numbers in the left column—the number of people getting better who took the skin cream or didn't. But this ignores the fact that many more people took the skin cream than didn't. To correctly answer this question, you have to consider all four cells of the table. You must compare the percentage of people who used the skin cream who got better to the percentage of people who didn't use the skin cream who got better. Of the 298 people who used the skin cream, 223, or 75% of them, got better. Of the 128 people who didn't use it, 107, or 84% of them, got better. The correct answer is that the skin cream is ineffective.

Why is this problem so difficult? In part, it's because Dan Kahan and his colleagues—who did the study I'm about to report—put their thumb on the scales. They chose data such that, if you use either of the two shortcuts I mentioned—comparing only the numbers in the top row or the left column—you'll get the wrong answer. Fifty-nine percent of the participants in this study answered the problem incorrectly.

This problem illustrates the difference between System 1 and System 2 thinking, the central metaphor of this blog. According to Daniel Kahnemann, in his book Thinking, Fast and Slow, we have two cognitive systems. System 1 is automatic and effortless. We simply say and do what feels right. The System 1 response to this problem is to say that the skin cream works, because that's what it looks like at first glance. System 2 is deliberate and effortful. It comes into play when we take the time to analyze a situation carefully. It can be used to correct the errors that System 1 is prone to making. In this case, System 2 requires that you do the math.

As difficult as this problem is, it has one thing going for it. We don't have any emotional investment in whether this skin cream works. But what if the issue were one about which we had a prior hypothesis? In this case, System 1 could lead us to a second source of error, confirmatory biasthe tendency the interpret new information in a way that is consistent with our prior beliefs and ideological biases. Compare the problem in Table 1 to these three other problems.

Table 2
Does a city-wide ban on concealed weapons increase or decrease crime? Conservatives would probably expect crime to increase (since people can no longer use their concealed weapons to shoot bad guys), and would be resistant to information suggesting that gun control actually works. Of course, the opposite is true for liberals. Kahan expected political ideology to affect participants' responses to the gun control questions, but not the skin cream questions.

Now let's introduce another variable into the mix—numeracy. (I realize this is getting complicated, but please bear with me. It's worth it.) Numeracy—analogous to literacy—refers to mathematical competence and a tendency to use quantitative reasoning in appropriate ways. You would expect numerate people to do better when making judgments of contingency, at least when evaluating skin creams. But what happens when numerate people encounter data contradict that their political views?

We know that liberals and conservatives clash over scientific issues such as gun control and global warming. Kahan suggests two theories to explain these political impasses. The science-comprehension thesis suggests that people don't have enough training in science and math. With better education, people would be capable of correctly interpreting the results of empirical studies. The identity-protective cognition thesis is more pessimistic. It argues that our ideological polarization is so great that it cancels out even the ability of well-educated people to utilize their math and science skills. If the confirmatory bias trumps numeracy, Kahan believes that this raises serious questions about whether Americans are capable of enlightened self-government. We may have to turn over important decisions to committees of experts. (But who will choose the experts?)

What do you think? The answer provided by Kahan's research comes in Part 2.

Tuesday, March 12, 2013

The Myth of the Conservative Voter

The obvious fact that majority public opinion is unable to prevail in Washington has set off a flurry of research on why the political system is so unresponsive. The latest contribution comes from David Broockman of the University of California, Berkeley, and Christopher Skovron of the University of Michigan. They sent surveys by mail and email to all of the 2012 candidates for state legislatures in the country. The response rate was 19.5% (1907 candidates), which is about double the typical response rate for mail and email surveys. The candidates were asked to estimate what percentage of their constituents would agree with the following statements:
  1. Same sex couples should be allowed to marry.
  2. Implement a universal healthcare program to guarantee coverage to all Americans, regardless of income.
  3. Abolish all federal welfare programs.
They were also asked their own opinions on the first two issues. A new technique called multilevel regression and poststratification (MRP) was used to estimate the attitudes of the citizens in each legislative district. It would obviously be very costly to survey the entire voting population each of the country's 6500 state legislative districts. MRP uses national survey data to determine level of agreement with the three statements based on education, race, gender, social class, religiosity and having voted for Obama. The percentage of people in each of these demographic subgroups in each legislative district is determined from the 2010 census. This generates an accurate estimate of the opinions of the people in each district. Although indirect, this method has been validated against real survey data.

There were positive correlations (rs = .43 to .51) across districts between the candidates' estimates and actual opinions, but they are not very impressive, accounting for only about 20% of the variance. The interesting thing about the data is that the candidates' perceived their constituents to be about 10% more conservative on these issues than they actually were, a difference roughly equal to the average difference between voters in California and Alabama. Stated differently, 60% of citizens would have to favor a liberal policy in order for their legislators to perceive them as a majority.


The responses were analyzed separately for liberal and conservative candidates based on their own answers to political questions. These data are shown in the table above. The horizontal axis represents the actual opinions in each district, and the vertical axis is the politicians' estimates. The black line is perfect accuracy. Anthing below it means the politicians are overestimating their constituents' conservatism. The blue line is the estimates of the liberal politicians, and the red line, the estimates of the conservatives. Although both groups believed their constituents were more conservative than they actually were, the conservatives seemed to be living in another world. They were off by over 20%. Nearly half the conservative candidates believed their district was more conservative than the actual opinions of the most conservative district in the entire country.

These findings may help us understand differences in the personal style of politicians. The well-known tendency of liberal politicians not to stand up for their beliefs contrasts sharply with the overconfidence of conservatives. Both may be explained by their fundamental misperceptions of public opinion.

Candidates were surveyed again after the election, but there was no evidence that they had learned anything. They were no more accurate than before, and their accuracy was unrelated to any of the activities they reported during the campaign, i.e., time spent talking with voters.

The first question about these data is their generalizability. The study should be replicated using federal and local as well as state candidates, and with a wider variety of issues. However, the differences are quite large, so I assume these findings are robust. How can they be explained? Broockman and Skovron do not speculate other than to suggest that political elites are not motivated to learn the attitudes of the people they represent.

Before giving them a political spin, we must be sure these errors are unique to politicians. It's possible that a random sample of the population might make errors of a similar magnitude and direction. If so, the data represent cultural influences to which we are all exposed. For example, the corporate media present an almost unrelentingly conservative view of the American public opinion, insisting that this is a “center-right” nation and referring to right-wing politicians as “moderates.” These data may reflect back what the media inaccurately tell us. The liberal-conservative difference may mean that the media outlets preferred by conservatives are even less accurate than those preferred by liberals.

Suppose the general public does not make errors that are comparable to these candidates—that is, these biases are unique to politicians. If these politicians are themselves more conservative than the general public, there might be a false consensus effect. False consensus refers to the tendency to assume that other people's opinions are more similar to our own than they actually are, to project our own beliefs onto others. There is reason to believe that political candidates are more conservative than the people they seek to represent, since so much money is required to run for office—either their own money or funds obtained from wealthy donors.

This shades into a second possibility, which we might call the “loudest voices” hypothesis. When considering this hypothesis, remember that money talks too. In fact, the Supremes have ruled that money is speech.

Suppose there are two types of political issues, economic and social. Economic issues are those issues that have major economic consequences, even they are sometimes debated using non-economic arguments. Therefore, they include not just taxation and public spending, but issues like climate change, health care, and foreign policy, including debates over war and peace. In the present study, health care and welfare are economic issues.

When the issue is economic, the loudest voices politicians are exposed to are those of campaign donors, whose views are well to the right of the general public. In fact, politicians may spend much of their time inside a bubble filled with rich contributors and corporate lobbyists. If you spend most of your time talking to these people, you are not likely to arrive at an accurate perception of what the general public thinks.

Social issues are those that have only minor economic consequences, such as abortion, gay rights and gun control. Although they are sometimes called “sideshow issues,” they are as important to some people as economic issues. For example, if you are pregnant, whether you have access to a safe, legal abortion is a matter of life and death. Social issues are represented in this study by gay marriage.

When the issue is social, political pressure comes primarily from grassroots organizations. Sadly, the loudest voices the politicians hear almost invariably come from the right. Conservatives are better organized, perhaps because they hold their attitudes with greater strength. Of course, what we call “grassroots” is sometimes actually astroturf. These groups receive financial and logistical help from the wealthy, since rich people know that they benefit when conservative candidates are elected.

Therefore, the loudest voices hypothesis suggests that, regardless of whether the issue is economic or social, the candidates hear mainly conservative voices. This is especially true of candidates who are themselves to the right of center. You can get a pretty distorted view of public opinion that way. Ask Mitt Romney.

Saturday, April 28, 2012

Don't Drink and Vote

Occasionally research brings what seemed to be separate topics together in an interesting way. I've previously noted that one purpose of this blog is to encourage thinking slowly—deliberate, effortful processing of information—in the hope of responding rationally to difficult social and political problems. A recent article by Scott Eidelman and three colleagues suggests that the opposite of slow thought—rapid, low effort processing of information—encourages political conservatism. They present four studies to support this claim.

As most of us know, alcohol consumption interferes with deliberative thought while leaving automatic responding largely intact. The first study was done as people were leaving a bar. Participants were asked to answer some questions and exhale into a breathalyzer, which measured their blood alcohol level. The questions included a ten item measure of liberalism-conservatism, as well as whether they considered themselves a liberal or a conservative. Statistically controlling for gender, education and political ideology, the authors found that the higher the participants' blood alcohol level, the more they scored toward the conservative end of the scale. Both self-identified liberals and conservatives were more conservative when they were more intoxicated. (In case you're wondering, liberals and conservatives were equally likely to get drunk.)

The other three studies were laboratory experiments. In the second, students responded to another opinion scale which measured liberalism and conservatism independently of one another. Cognitive load was manipulated by requiring some participants to perform a secondary task (counting tones of different pitches) while filling out the questionnaire. The others merely filled out the scale. Distraction was expected to interfere with their ability to think about the opinion items. As predicted, the participants with the higher cognitive load scored higher in conservatism and lower in liberalism.

In a third study, participants rated the favorability of liberal and conservative concepts such as “civil rights” and “law and order.” Opportunity to think was manipulated by giving some participants only 1.5 seconds to respond to each item, while the others could take as long as they wanted. The high time pressure subjects rated the conservative terms more favorably. They also rated the liberal terms less favorably, but the difference was not statistically significant.

Finally, in the last study, participants rated the liberal and conservative concepts under instructions to think quickly or slowly. In the low effort condition, they were told to “give your first, immediate response to the terms” and to not “think too hard.” In the high effort condition, the instructions were to “think hard about each term,” to “take your time and give a careful and thoughtful response.” The task was followed by a pop quiz—a recognition memory test. Participants were shown many concepts and asked to identify the ones they had previously rated. The low effort participants rated the conservative terms more favorably than the high effort participants. (As before, the effect on liberal terms was not significant.) The recognition memory task served as a measure of depth of thought and, as predicted, it partially accounted for the relationship between low effort thinking and conservatism. (That is, if you statistically eliminate the effect of recognition memory scores, the relationship between low effort and conservatism is reduced, but still statistically significant.)

How do the authors explain these results? First of all, they are not saying that conservatives are less intelligent than liberals (although there is some evidence that this is the case). Both liberals and conservatives were affected by these manipulations. They are also not saying that conservative ideology is cognitively simpler than liberalism (althought there is quite a bit of evidence that this is true). In these studies, independent samples rated the complexity of the liberal and conservative statements and concepts to ensure that they were equally difficult to understand.

Here's their argument: There are three aspects of the content of conservative ideology, all of which we are more likely to believe when processing information automatically, but which we question when we engage in deliberate, effortful thought. They are:
  • a tendency to see people as personally responsible for their outcomes, rather than acknowledging that their behavior could be situationally caused.
  • an acceptance of heirarchy—inequality between people and groups (such as the rich and the poor).
  • a preference for the status quo rather than social change.
Since there is evidence that these three bulwarks of conservative thought are more likely to occur when we are operating on automatic pilot, distracting people, forcing them to respond in a hurry, asking them not to think too hard, or getting them drunk all will make them more conservative. It appears that conservative thinking comes more easily to us. To avoid being reflexive right wingers, we have to put down the beer, turn off the TV, and think about it. That could be a sobering message.

Saturday, April 14, 2012

The Elephants' Playground

One of the more baffling phrases in American pop culture is “the liberal media.” In fact, study after study has found that the news media and their employees are conservative in an absolute sense, and more conservative than the American public. This not surprising if you simply assume that the giant corporations that control our supply of news and entertainment are rationally pursuing the self-interest of their owners.

For many years, Fairness and Accuracy in Reporting (FAIR) has been studying news media bias by doing content analyses. The latest issue of their magazine, Extra, contains an analysis by Peter Hart of the guest list of the four most popular Sunday morning talk shows—Meet the Press (CBS), Face the Nation (NBC), This Week (ABC) and Fox News Sunday—from June 2011 through February 2012 (eight months). These are the people who get the opportunity to sit down at the table and present their political views to the public on network TV. (Unfortunately, this study is not available online.)

The guests on these programs fall into two categories: one-on-one interviews and roundtable discussions (segments with more than one guest). Guests were coded by profession, gender and race. Overall, 47% of the appearances were by politicians, and most of the rest (43%) were by journalists. Politicians were coded by party. Non-politicians who have clear ideological leanings were coded as liberal, i.e., Paul Krugman, or conservative, i.e., George Will.

Conservatives rule. Of the 264 people who were interviewed one-on-one, 236 were affiliated with American political parties. 166 (70%) were Elephants and 70 (30%) were Jackasses. (The remaining 28 unaffiliated people were considered too small a sample to analyze.) Of the 647 roundtable guests, 289 were politicians—180 (62%) Elephants and 109 (38%) Jackasses. Of the remaining 358 nonpoliticians, 102 (28%) were conservatives, 55 (15%) were liberals, and 201 (56%) were centrist or unclassifiable. To summarize, of the 393 roundtable guests presumed to have ideological leanings, 268 (68%) were either Elephants or conservatives, and 125 (32%) were Jackasses or liberals. (I realize it makes little sense to call many of these Jackasses “liberals” and perfect sense to label all of the Elephants “conservatives,” but that's a story for another day.)

The experience of actually watching these programs is one in which primarily conservative guests are interviewed by mostly centrist journalists. Progressives need not apply. Largely absent from the discussion were representatives of nonprofit or public interest groups—civil rights, labor, environmental, etc.—whose views are obviously of little interest.

White men also rule. The one-on-one interviewees were 92% white and 86% male. (Seven of the 15 African-American interviewees were Herman Cain. The media love black conservatives, since they give the visual appearance of balance without the reality.) The roundtable guests were 85% white and 71% male. During part of the study period, This Week was hosted by Christiane Amanpour. She took a different approach, featuring more international news, and having more women and people of color as guests. After less than a year, she was quietly dumped.

Since FAIR is a liberal organization, we might question whether the study itself is biased. However, most of the data collection leaves little room for error. The only subjective judgment is the classification of the nonpolitician guests as liberals, conservatives or centrists. But the results of this analysis are so consistent with the other findings of this and previous studies that I see no obvious reason to question their validity.

These results are similar to many previous analyses which find conservative dominance of political talk on all networks, including PBS. When Elephants are in the White House, this is usually justified by a need to focus on what people in power are doing. When the Jackasses are in power, the rationale changes. In this case, it could be argued that several Elephants were competing for the presidential nomination and therefore making news. However, Hart notes that a survey conducted during the most relevant comparison period, 2003-2004, when several Jackasses were hoping to run against George W. Bush, found the usual Elephant/conservative dominance.

The reality is that no matter who is in power and what is going on in the world at the time, conservatives dominate the television guest list. Some of them will no doubt be heard complaining about the “liberal” media.

Tuesday, February 14, 2012

Deadbeats for Self-Reliance

Binyamin Appelbaum and Robert Gebeloff had an article in Sunday's New York Times suggesting that some of the people who are most in favor of severe cuts in government domestic spending are also highly dependent on the federal safety net. This chart—actually a scatterplot—by Aaron Carroll supplements that article. It shows that the residents of conservative states get more help from the government than liberal state residents. The chart requires some explaining.


The vertical axis measures government help. “Transfer receipts” refer to all the payments made by the federal government to individuals, such as social security, Medicare and unemployment benefits. It is divided by total personal income to yield a percentage, so .20 on the chart means that the people of that state derive 20% of their income from government programs. As you might expect, those states that are higher on the vertical axis are those states whose per capita income is lower.

The horizontal dimension refers to how liberal or conservative the state was in a 2010 Gallup poll. “Conservative advantage” refers to the percentage of self-identified conservatives minus the percentage of self-identified liberals. From left to right, the “conservative advantage” increases. The size of the circles represents the population of the states.

The trend is obvious. The more conservative the state, the more government “handouts” its citizens receive. Including all 50 states yields the same result. Of the 25 most liberal states, 16 of them pay more in taxes than they get back. But 23 of the 25 most conservative states are on the receiving end of wealth redistribution. This also translates into voting behavior. Seven of the ten most dependent states voted for McCain in 2008, while only two of the ten least dependent states did.

There are two tempting ways to interpret this chart. One assumes that red state citizens are aware of the inequity from which they benefit and are hypocrites. The Times article reports that when the conflict between their attitudes and their behavior is pointed out to some of them, they rationalized that they “deserve” their government benefits while most other recipients do not.

Another possible interpretation is the false consciousness argument from Thomas Frank's What's the Matter with Kansas? It suggests that poor state residents are confused and, without realizing it, are voting against their economic self-interest. In effect, they have been duped by the Elephant Party, which appeals to them with ads about abortion and gun control, but once in office, uses their electoral advantage to enact economic policies which primarily benefit the wealthy.

(Of course, you could also argue that anyone who voted for the Jackass Party in the last 20 years has been duped, since once in office, the Jackasses have rather consistently done the opposite of what they promised to do during the campaign.  See "The Mourning After.")

A new analysis of wealth and voting patterns by Andrew Gelman adds some interesting data to the mix. He finds that, in all 50 states, the higher your income, the more likely you are to vote for the Elephants, as would be predicted by self-interest. However, the higher the per capita income of a state, the higher the share of its vote that goes to the Jackasses. That is, there is something about the culture of the poorer states, perhaps relating to social rather than economic issues, that persuades their people to vote for the Elephants.

Furthermore, the relationship between income and party preference is stronger in the poorer states than in the richer ones. As a result, a high percentage of low income people in all states—rich and poor—vote Jackass. But in the poorer states, the middle class and especially the rich, vote strongly Elephant, while in the richer states, there is a higher percentage of Jackass voters among middle and higher income people.

In other words, most of the poor people in all the states are not confused. They vote in their self-interest. But in the higher income states, people who are not themselves poor vote in a way that appears to benefit the poor. (If anyone votes contrary to their self-interest, it's rich people from Connecticut.) In the low income states, upper middle class and rich people vote in a way that is more consistent with their economic self-interest and that is harmful to the interests of the poor. Here's a presentation by Gelman:


Of course, all of these data are correlational, and correlation does not mean causation. A wealthy Mississippian may not necessarily have voted for McCain because he wanted poor people to starve. He may have been motivated more by an opposition to gay marriage, and the effect of his vote on the plight of the poor may have been incidental. Voting is complicated.