Showing posts with label inequality. Show all posts

Saturday, July 12, 2014

The Matthew Effect

The Matthew effect is a term introduced by sociologist Robert Merton in 1968. It takes its name from Matthew 25:29, the parable of the talents:

For unto everyone that hath shall be given, and he shall have abundance; but from him that hath not shall be taken even that which he hath.

In other words, the rich get richer and the poor get poorer. Merton suggested that the positive behaviors of high status people are more likely to be recognized and rewarded than those of low status individuals, while high status people's mistakes are more likely to be overlooked. This creates a positive feedback loop in which increased confidence causes their performance to improve and their reputation to increase over time. The opposite happens to low status individuals. Their mistakes are more apparent, leading to negative feedback, stress and disruption of performance.

Merton also coined the term self-fulfilling prophecy, in which predictions result in behaviors that cause the predicted outcome to occur.  The Matthew effect is a type of self-fulfilling prophecy in which the observer's positive (or negative) expectations cause more (or less) successful behavior in the target over time. This has broad implications for people's self-esteem and the inequality of their social and economic outcomes.

Two business school professors, Jerry Kim and Brayden King, looked for evidence of the Matthew effect in major league baseball. They predicted that a pitcher's status would influence calls by the home plate umpire. Pitcher status was defined as the number of times he had previously been chosen to the All-Star team. It was predicted that, as the number of All-Star appearances by a pitcher increased, more of their balls would be called strikes (over-recognition) and fewer of their strikes would be called balls (under-recognition). The study was made possible by the Pitch f/x system, in place in all major league ballparks, in which cameras objectively measure whether each pitch is in the strike zone.

© www.sportvision.com
The data base was all the pitches taken (not swung at) by the batter during every game of the 2008 and 2009 seasons. These pitches must then be called either a ball or a strike by the umpire, and each call was evaluated for correctness. These data were related to over two dozen pitcher, batter, catcher, umpire and situational characteristics. Some of these variables are of real importance to baseball fans, but they could all be statistically controlled in order to evaluate the status hypothesis.

Baseball fans may be interested in the big picture—the distribution of correct and incorrect calls among the almost 800,000 calls the researchers measured.


Called Ball
Called Strike
Actual Ball            
87.10%
12.90%
Actual Strike          
18.80%
81.20%

The umpires were correct about 85% of the time. (There were more actual balls than actual strikes.) Umpire bias favored the batter, since more strikes were called balls than balls were called strikes. The count (the number of balls and strikes to that point) had a big effect. For example, the likelihood that the umpire mistakenly called a strike was 62% lower when the count was 0-2 and 49% higher when the count was 3-0. Apparently, umpires don't like their call to end an at-bat. Umpire calls also tended to favor the home team. Errors of both over- and under-recognition increased with the situational importance of the at-bat.

The hypothesis was strongly confirmed. Look first at over-recognition: Holding all other variables constant, the more trips a pitcher had made to the All-Star game, the more likely a ball was to be called a strike. The probability of a mistaken strike call increased from 12.8% among pitchers who had no All-Star appearances to 14.9% among pitchers with five or more appearances. Each additional trip to the All-Star game increased the likelihood of over-recognition by 4.9%.

The situation was reversed for under-recognition, also confirming the hypothesis. A strike thrown by a pitcher with no All-Star appearances was mistakenly called a ball 18.9% of the time, but only 17.2% of the time if the pitcher had five or more appearances. Each trip to the All-Star game decreased the likelihood of under-recognition by 2.7%.

In further analyses, the authors were able to show that, with this large data set, pitcher status also had statistically significant effects on the outcome of the at-bat (the total bases reached by the batter) and the game (whether the pitcher's team won). In an analysis that made some admittedly questionable assumptions, they calculated that umpire errors alone were worth approximately $575,000 in salary to a high status pitcher over the course of his career.

© totallycoolpix.com
Of course, Matthew effects can occur any time one person evaluates another—a teacher grading a student, a boss rating a worker, a reviewer reading a manuscript, etc. As a demonstration of how quickly performance expectations can occur, consider a study by Ned Jones and others. Participants watched a videotape of a college student answering 30 difficult questions, with feedback after each item indicating he had answered 15 of them correctly. In the ascending condition, the student gradually improved. He got three of the first ten right, five of the second ten, and seven of the last ten. In the descending condition, the pattern was reversed. (The difficulty of the questions was held constant by asking exactly the same questions in the opposite order.) First impressions mattered a great deal. The student was rated as more intelligent in the descending than in the ascending condition. The authors had hoped the ascending student would get some credit for improvement, but it didn't happen.

In this experiment, as in baseball, the expectations were based on the target's actual past performance. However, expectations can be based on gender, race, class or other social categories. In other words, stereotypes based on group membership can create self-fulfilling prophecies leading to discrimination.

There is no reason to think that umpires and ballplayers are consciously aware of the systematic nature of these errors. A New York Times article about the Kim and King study included the usual quotes from baseball people expressing their surprise at or disbelief in the results. Most teachers, bosses and reviewers probably think they're being objective, too.

In major league baseball, the technology is already in place to have balls and strikes called automatically using the Pitch f/x system. Why would anyone (except maybe Clayton Kershaw) not think that's a good idea?

You may also be interested in reading:

Is Democracy Possible? Part 1 (see also Parts 2 and 3)


Wednesday, February 26, 2014

Does Money Make You Mean?

I've previously written about studies by social psychologists Dacher Keltner and Paul Piff that show that wealthy people are less helpful and more likely to engage in unethical behavior than people of average means. TED has released an entertaining 16-minute talk by Dr. Piff discussing and showing video of some of these studies.


Although I find the studies, in the aggregate, quite persuasive, I'm less impressed with Dr. Piff's suggestions for change. In fact, they illustrate some of the limitations of social psychology as a discipline.
  • Dr. Piff recommends priming prosocial concepts—he calls them “nudges”—to encourage prosocial behavior. Such prompts are not very common in a capitalist society, and their effects are likely to be temporary, since they are certain to be drowned out by prompts that encourage selfish behavior, such as those contained in advertising.
  • Like most psychologists, he advocates an individual solution to encouraging helpful behavior, when the real problem is structural. Changing rich people one rich person at a time is a slow process, especially when you're asking them to swim upstream against the influence of their culture.
  • His suggested solutions are directed only at symptoms of the problem, such as failure to help people, and do not address what he identifies as the cause of the problem, social inequality, which, as he says, continues to increase.
You may also be interested in reading:


Monday, August 26, 2013

Me First

The evidence of increasing wealth inequality in the United States, combined with self-interested attempts by the organized rich to deny a financial safety net to the poor, have led researchers to examine differences in the psychological cultures of people of different income levels. Social psychologist Paul Piff and his colleagues have proposed that wealthy Americans are less helpful than their middle class or poor fellow citizens.

Despite some highly publicized counterexamples, rich people donate a smaller percentage of their income to charity than poor people. In a 2001 survey, the Independent Sector found that families earning less than $25,000 per year give away on average 4.2% of their incomes to charity, while those earning more than $75,000 per year give away 2.7%. In a series of four laboratory experiments, Piff and his colleagues found upper class participants to be less generous, trusting and helpful than lower class participants. A new set of seven studies by Piff and others both broadens the evidence for upper class selfishness by examining the relationship between social class and ethical behavior, and looks more carefully at the reasons for it.

That part of Piff's research that has captured mass media attention is two studies of class differences in driving behavior. As one blogger put it, “Rich people are more likely to drive like assholes.” In these studies, observers surreptitiously watched whether drivers illegally cut off other cars at an intersection, or illegally cut off pedestrians in the crosswalk. Cars were classified into five categories of status depending on their age, make and appearance. (Observers were able to do this with high levels of agreement.) The results are shown below, and were statistically significant.


Of course, the conclusion that rich people are more likely to behave illegally depends on there being a high correlation between people's personal wealth and the value of their car. The authors cite one source for this plausible assertion; I have not yet been able to track it down.

The remaining five studies were laboratory experiments which compared the willingness of students of different family income levels to engage in mildly unethical behaviors such as helping themselves to candy intended for children, cheating in an experimental game, or reporting greater willingness to engage in unethical behaviors at work. An important purpose of these studies was to look at the relationship between these behaviors and a measure of favorable attitudes toward greed, i.e., “Overall, greed is moral.”

In all five studies, upper class participants showed greater willingness to behave unethically. The measure of greed also predicted unethical behavior. More importantly, the relationship between social class and unethical behavior was mediated by greed. That is, the relationship between social class and misbehavior was no longer significant after statistically eliminating the effect of greed.

To further demonstrate the mediating role of greed, Piff primed the idea that greed is good by asking participants to list three social benefits of greed. Not only did students given this prime endorse more unethical behaviors, but the differences between the social classes disappeared. That is, the lower and middle class students endorsed just as many unethical behaviors as the richer students after completing the “greed-is-good” exercise.

Piff's explanations for his results is that wealthy people are not dependent on others to meet their needs and have better resources to cope with unanticipated costs of unethical behavior, i.e., they can better afford a traffic ticket. Their privileged situation encourages goal-directedness, self-centeredness, and lack of concern for others--an attitude of entitlement. The results are social values that view greed as positive, and that in turn lead to less helpful and more unethical behavior. Piff mentions economics education as an additional factor that may encourage upper-class greed.

Since Piff's subjects were college students, I'm surprised he didn't mention parental modeling as a contributing factor. In my view, unethical behavior is deeply embedded in the capitalist system. Adult endorsement of greed may be part of an attempt to justify past selfish and unethical behavior in the workplace, behavior which is perceived as having been required for career advancement, or even to keep one's job.

You may also be interested in reading:


Tuesday, February 19, 2013

Raising the Floor

President Obama, in his State of the Union speech, made two proposals that will reduce inequality, and that have strong research support—raising the minimum wage and universal pre-school. The main difference is that raising the minimum wage is a short-term, direct solution to inequality. It proposes to help the working poor by ensuring that they make more money. Universal preschool, which I'll discuss in a future post, is about making kids more socially mobile 20 years from now. Not surprisingly, more things can go wrong with that plan.

The current federal minimum wage is $7.25 per hour, which is $15,080 per year—well below the federal poverty level for a family of three, and well below the minimum wage in most industrialized countries. The value of the minimum wage in this country peaked in 1968 at $10.56 per hour in inflation adjusted dollars. But worker productivity has risen sharply since 1968. If the minimum wage had kept pace with productivity growth, it would be $16.50 per hour. Obama proposes to raise it gradually to $9 (24%) by 2015—hardly a radical proposal—and index it to the rate of inflation thereafter, so that it increases with the cost of living without requiring action by Congress. For comparison, the top 1% increased their real income (adjusted for inflation) by 281% between 1979 and 2007. Although every income group lost money during the Great Recession, during the economic recovery (2009-2011), income increased by 11.2% for the top 1%, but declined by -.4% for the bottom 99%.


In a 2012 survey, raising the minimum wage to $10 in 2014 and indexing it to inflation thereafter was favored by 73% of Americans, with 20% opposed and 7% undecided. Support is strongest among Democrats and those who would be helped most by the proposal—women, minorities and young adults.

Unfortunately, there is an incorrect argument about the effect of raising the minimum wage that appeals to the conventional wisdom. It states that raising the minimum wage causes employers to hire fewer workers or lay off existing workers. House Speaker John Boehner reacted to the President's proposal by saying, “When you raise the price of employment, guess what? You get less of it.” Fortunately, this is an empirical question, and Boehner is wrong.

The fact that the minimum wage has stagnated since 1968, while bad for the country, has been a boon to research on its effects. Some states and cities have raised the minimum wage above the federal level. This variability makes it possible study whether raising the minimum wage depresses employment. The modern history of this research begins with a before-after comparison group design by Card and Kreuger. New Jersey increased its minimum wage in 1992 while Pennsylvania did not. The authors did a telephone survey of employment in fast food restaurants in counties along the NJ-PA border. (Restaurants were chosen because they are the business that experiences the greatest increase in cost when the minimum wage goes up.) They found no evidence that NJ's minimum wage reduced employment relative to PA.

Of course, this could be an atypical case. But Dube, Lester and Reich published a study in 2010 comparing restaurant employment in 318 state borderline pairs of counties in which the minimum wage differed, essentially replicating the Card and Kreuger study over a much larger sample of times and locations. They found no employment effects. In recent years, there have been two meta-analyses of minimum wage studies, one of which summarizes 1492 separate tests of the minimum wage hypothesis. They find no significant overall effect on employment among low income workers, teenage workers, or anyone else. (By the way, 80% of minimum wage workers are adults.)

These studies are now well accepted by economists, but they raise the question of why the conventional wisdom is wrong about the effects of raising the minimum wage. The most likely reason is that, for most owners, the cost of increasing the minimum wage is small relative to other costs affecting their business. Schmitt has suggested 11 “adjustment channels” that might explain the lack of a minimum wage effect. Here are the four that he feels have the greatest research support.
  • Increasing the minimum wage reduces turnover, an important cost savings for employers.
  • Workers who are paid more increase their productivity, either on their own, since the job is more important to them, or in response to employer demand.
  • The cost is passed on to consumers in the form of increased prices. Does this cause inflation? Yes, but not very much. One study found that a 31% increase in the minimum wage increased restaurant prices between 1% and 2%, at worst increasing the cost of a $10 meal to $10.20.
  • In the long run, employers compensate by reducing wages paid to higher wage workers. This results in “wage compression,” or less wage inequality within the organization.
Of course, Boehner's comments suggest that the President's plan is dead on arrival in Congress. But let's imagine we lived in a country where some wage relief for the working poor were possible. If the minimum wage is to be indexed to inflation, it is important that it start from a baseline that is high enough to be fair to low income workers. The data in the second paragraph suggest that $9 is too low. Wicks-Lim has suggested that businesses could easily adjust to a 70% rise in the minimum wage to $12.30 per hour. Raising the minimum wage could be seen as a form of reparation for the harms caused to low wage workers by the successful class warfare waged by the rich for the past 30 years.

Sunday, April 22, 2012

Class Acts

The number of Americans living below the official poverty line is at its highest level in decades. On the other hand, our political leaders are drawn from those Americans who are highest in socioeconomic status. The average wealth of members of Congress is $13.2 million in the Senate and $5.9 million in the House. Eleven percent of Congress are in the top 1% of the income distribution. These Congresspeople are considering taking serious steps to dismantle the social safety net that is critical to the survival of an increasingly large number of poor Americans. What can social psychology tell us about differences in the attitudes of rich and poor Americans toward personal responsibility, and about differences in their willingness to help those in need or to deliberately hurt other people?

A recent series of experiments by social psychologists led by Dacher Keltner at the University of California at Berkeley have studied the psychology of social class. First, a word on how social class was measured. In some studies, it was measured objectively by asking participants to state their own (or their parents') income and educational attainment. Subjective social class was measured by asking participants to place an “X” on one of ten rungs of a ladder representing their status compared to others. Finally, in some studies, social class was manipulated by having participants to write an essay comparing their own life to that of either a rich or a poor American. Comparing yourself to the poor makes you feel richer, while comparing yourself to the rich makes you feel poorer. These different approaches produced generally consistent results.

Explanations of human behavior can be divided into personal causes (some characteristic of the behaving individual) or situational causes (some aspect of the social environment). How do the rich and the poor explain economic inequality? The Berkeley group hypothesized that since poor people have fewer resources, they exert less personal control over their own outcomes, and they see inequality as more a product of situational forces than the rich. Keltner and his colleagues called their participants' attention to inequality in this country by presenting statistical data. Participants were then asked to rate the importance of twelve explanations of inequality. Some of them were personal (talent, hard work) while others were situational (inheritance, discrimination). These studies also included a measure of personal control over one's own life.

As expected, upper class participants gave more personal explanations for wealth and poverty, and the relationship between social class and social explanation was mediated by feelings of personal control over one's own life. (See my earlier post on I. Q. and prejudice for an explanation of how mediational hypotheses are tested.) Subsequent studies showed that these tendencies to explain behavior as personally or situationally caused apply to other outcomes in addition to economic inequality. If members of economic and political elites believe they have earned their favorable position, and that poor people fail because they lack positive traits, will they be more willing to eliminate social programs that to help the poor?

Do upper and lower classes differ in helpfulness? The Berkeley group proposed that, because the poor depend more on other members of their community for help in times of crisis, they would be more sensitive to the needs of others, more compassionate, and more helpful. An alternative possibility is that because the poor have less, they will be more reluctant to give it away and will be less helpful. In one of their studies (called the “dictator game”), participants were given ten points (later to be exchanged for money) and allowed to split them however they chose between themselves and an anonymous partner. Lower class participants were more generous to their partners. In another study, people were asked how much of one's income a person ought to donate to charity. In this study, social class was both measured objectively and manipulated (by having them compare themselves to the rich or the poor). The results are shown in this chart.


The lines labeled lower and upper class rank refer to the manipulations of thinking about the rich or the poor respectively. High and low social class refer to their objective status (family income and education). Using both measures, the poor were more generous. This finding corresponds to real world studies which consistently show that poor people donate a higher percentage of their income to charity than rich people.

One study tested the hypothesis that the helpfulness of the poor is mediated by compassion. Compassion was manipulated by showing a short film about child poverty or a neutral film. Participants were later given an opportunity to help a fellow student in distress. When shown the neutral film, lower class participants were more helpful than upper class participants. When the compassion-inducing film was shown, there was no difference. The rich were capable of being helpful when reminded of the need to be compassionate. However, the poor appeared to be spontaneously helpful.

Might the upper class's lack of helpfulness also mean that they are more likely to behave unethically for selfish reasons? The Berkeley group did seven studies of social class differences in unethical behavior. When most Americans think about criminal behavior, they think of lower class street criminals whose behavior is heavily publicized by the media. However, the researchers expected the rich to endorse greed as a legitimate motive and behave more unethically than the poor. Two of the studies were observations of drivers. Wealth was measured by the monetary value of their car. Drivers of expensive cars were more likely to cut off other drivers at a four-way stop and to fail to yield the right of way to pedestrians—both illegal under California law.

In other studies, upper class participants took more candy which, if they hadn't taken it, would have been given to children; cheated more on a laboratory task in order to win a monetary prize; and reported greater willingness to lie, steal and behave unethically in hypothetical scenarios. Finally, the authors demonstrated that the unethical behavior of the rich was mediated by greed. Greed was manipulated by asking some participants to list three reasons why greed might be a good thing. Others completed a different list. They then filled out a measure of willingness to endorse unethical behaviors on the job, such as borrowing money from the cash register overnight. When greed was primed, lower class participants endorsed as much unethical behavior as wealthier participants. Without the greed prime, the usual social class differences were obtained.

These studies are impressive both in number and consistency. Obviously, none of these behaviors rise to the level of the recent financial crimes that have cost middle class Americans billions of dollars. But at the very least, they suggest that mass media stereotypes of the rich and the poor need adjustment. In my last post, I reported studies showing that the decisions made by our political leaders correspond most closely to the preferences of the rich. When the wealthiest Americans decide the future of the country during a long recession, they seem almost certain to increase inequality--a problem that has already gotten far out of hand.

Friday, April 20, 2012

Whose Opinion Matters?

On Monday, the Senate voted 51-45 (nine votes short of the supermajority needed) to block debate on the Buffett Rule that would have required millionaires to pay an income tax rate of at least 30%. A CNN poll showed that 72% of Americans favored the rule. This is just one of many policies—from ending the war in Afghanistan to providing a public option for health insurance—that were favored by a majority of Americans, but not by corporations or wealthy Americans, that have been defeated. How responsive is our political system to public opinion? And to whose opinions does it respond?

These questions are difficult to answer. Prevailing research can only tell us how well legislation corresponds to public opinion, and whose opinions it matches. In other words, we can look at the correlations between the attitudes of the population—or population subgroups—and political decisions. But if a positive correlation is found, that doesn't necessarily mean that the people are influencing their legislators' votes. The politicians could have persuaded the public to accept their policies. Or both the public and their legislators could be reponding to a variety of third variables, such as their shared background, real world events, or media coverage of political issues. Therefore, instead of talking about the public's “influence” on politicians, I will refer to the “consistency” between their opinions.

Early studies of consistency used the box-score method, comparing the majority preference on a particular issue, as indicated by public opinon polls, to subsequent legislative decisions. Chance alone would ensure that legislators would agree with the majority half the time even if they completely disregarded public opinion. Political scientist Alan Monroe found that in over 500 Congressional decisions between 1980 and 1993, the outcomes corresponded with public opinion 55% of the time. This was better than chance agreement (50%), but not much better. If our legislators follow the wishes of the majority 55% of the time, does this mean that we have a responsive government? Monroe reports that between 1960 and 1979, agreement was 63%, so whatever it means, it's going down.

Larry Bartels studied differences in the consistency of U. S. Senators' votes with the attitudes of their constituents of different social classes. He measured the relationship between participants' self-ratings on a 7-point liberalism-conservatism scale and all the decisions made by their Senators between 1988 and 1992. The respondents were divided into approximately equal thirds by income. (For convenience, I'll call them the “rich,” the “middle class” and the “poor.”) Through a complex (but not controversial) mathematical procedure, Bartels estimated the “weight” that should be given to upper, middle and lower class opinion in order to produce the best match with the Senators' decisions.

The opinions of both the middle class and the rich corresponded with the choices of their Senators, but the weight associated with the opinions of the rich was about 50% greater than the weight of the middle class. The opinions of the poor, however, were given no weight at all. (Their opinions were actually slightly negatively related to their Senators' votes.) These class differences were not as great on social issues, such as abortion, as on economic issues, but in all categories, rich people's views were most consistent with the outcome, and the views of the poor were unrelated to the outcome. Of the specific bills Bartels studied, the greatest inequality occurred on a proposal to increase the minimum wage. Here, neither the wishes of the poor nor the middle class had any weight at all, and the decision corresponded exclusively to the opinions of the rich. (I don't need to tell you what the Senators decided.)

Bartels divided the Senators by party affiliation. He found that the Elephants' votes were about twice as consistent with the views of the rich as the Jackasses' votes. Both parties were equally responsive to middle class opinion and equally unresponsive to the poor.

Martin Gilens compared the results of surveys (conducted between 1981 and 2002) asking people whether they favored 1781 proposed policy changes to subsequent votes on those policies. This allowed him to locate the best-fitting curve relating public opinion to Congressional decisions. He found a strong status quo bias. That is, as the percentage of people favoring a policy change increased, its probability of being enacted also went up, but even when a policy had 90% support, its probability of passing was only 46%.

He then divided the country into ten deciles according to income, and compared the opinions of people who were richer than 90% of Americans to the opinions of eight other groups, all the way down to the 10th percentile of the income distribution. He found that the votes were consistent with the preferences of all ten economic subgroups, but as wealth increased, the correpondence between their preference and the decision increased. However, this analysis may have overestimated the consistency of the attitudes of the poor with politicians' votes, since in most cases they agreed with the rich. Gilens then did an analysis of the 887 cases in which there was significant diagreement on the policy among people at different income levels. Here are two charts showing these results.


The top chart compares the consistency of legislators' votes with people at the 90th and 10th percentiles of the income distribution. The positive slope of the 90th percentile line indicates that as more rich people favor the policy, its probability of passage goes up. On the other hand, the 10th percentile line is flat, indicating that the opinions of the poor are unrelated to the outcome. The bottom chart compares the rich with the middle class (the 50th percentile). Unlike the poor, the middle class appear to have some influence, but of course not as much as the rich.

Why do the views of the rich carry more weight? Maybe they're more likely to vote, more likely to contact their Senators, or more knowledgable about current events. The surveys Bartels used asked participants to state whether they had voted or contacted their Senators. It also included a measure of political knowledge. Since all three of these measures were positively related to income, they were all associated with greater consistency between the respondent's views and those of the Senators. However, statistically controlling for turnout, contact and political knowledge reduced the difference between the apparent influence of the rich and poor by only 24%.

Unfortunately, the survey did not ask participants whether they had made political contributions. Looking at other data on campaign contributions by income level collected at that time, Bartels estimated that if the Senators had based their decision only on contributions, they would have given six times (600%) more weight to the views of the rich than the middle class and almost no weight to the poor. The actual disparity in weight between the rich and the middle class (50%) was not as great as the differences in contributions would have predicted.

I'm bothered by the fact that in these studies the "rich" are defined as either the top third of the income distribution (Bartels) or the 90th percentile (Gilens). These subgroups include some people who might be considered upper middle class. It would be interesting to know how consistent the opinions of the top 1% are with those of the politicians. Gilens data seem to imply that as wealth increases, agreement also increases. Is there any upper limit to this effect?

Of course, these data are mostly from the 1980s and 1990s.  Over time, both the absolute amounts and percentages of campaign contributions coming from the rich have increased. This is probably especially true since the 2010 Citizens United decision, which allows unlimited contributions by corporations and the rich. But since the decision also allows these contributions to be anonymous, their impact will be difficult to measure.

Those who believe the U. S. political system is a plutocracy rather than a democracy will find these data to be at least consistent with their theories, particularly on economic issues, although the middle class's opinions are given almost as much weight as those of the rich when the issue is of little economic importance. The poor, however, have been effectively disenfranchised when their opinions differ from those of the rich. Given the secrecy with which political decisions are made, it will be difficult to find conclusive proof of quid pro quo corruption.

Thursday, April 12, 2012

Bending the Curve

The United States is number one among industrialized countries in income inequality. Right now, our wealth distribution is more unequal than at any time since the 1920s.

I believe that inequality is one of the most important dimensions that separates societies that work well from those that don't. One way societies break down is when people cheat. In an unequal society, the stakes are higher. The differences between the lives of rich and poor people are greater, and the social safety net protecting the poor is, well, porous. In this competitive environment, some people may decide the end justifies the means and behave dishonestly. Two recent studies support this reasoning. Unfortunately, American white collar criminals don't usually volunteer to be studied by social scientists, so we'll have to settle for college students (some of whom will no doubt “grow up” to be white collar criminals).

A new study by Lukas Neville examines a ubiquitous form of academic dishonesty, plagiarism—specifically, purchasing research papers over the internet. Google Correlate publishes anonymous summaries of the frequencies with which various search terms are used, aggregated by state. Neville measured six queries such as “buy term papers,” used between 2003 and 2011. States were ranked for inequality using the standard economic measure, the Gini coefficient. The analysis factored out common sense control variables such as the number of college students in the state. The result was a significant positive correlation between state level inequality and dishonesty—the greater the inequality, the greater the attempted plagiarism. Income inequality accounted for about 10% of the variance in this form of cheating.


Neville's study also measured generalized trust using questions such as whether “most people can be trusted,” taken from six state-level surveys. Trust was negatively related to both inequality and dishonesty. A mediational analysis suggested that trust mediates the relationship between inequality and cheating. (See my earlier post on IQ and racism for an explanation of how mediational hypotheses are tested.) Although correlation does not imply causation, the data are consistent with this interpretation: In an unequal society, people don't trust their peers to behave honestly. Therefore, they themselves decide to cheat, either in conformity to what they perceive to be a norm of dishonest behavior (“everybody does it”), or to protect themselves from other cheaters (“if I don't plagiarize, my grades will suffer”).

A recent experiment by Gino and Pierce also found a relationship between inequality and cheating. In this study, the authors created inequality before the experiment began by conducting a lottery in which half the participants were randomly given $20. For purposes of this study, those who got $20 were called "rich" and those who did not were "poor." The students then performed a task in which one of them attempted to solve anagrams for monetary prizes, while another graded the solver's performance. Graders could cheat by incorrectly reporting their partner's score. The researchers were able to detect any dishonesty. Since each student was randomly assigned a partner, there were four types of pairs: rich solver-rich grader, rich solver-poor grader, poor solver-rich grader, and poor solver-poor grader.

Most of the cheating occurred in the two conditions of unequal wealth. In the rich solver-poor grader condition, the graders attempted to hurt the solvers by understating their performance. In the poor solver-rich grader, helpful cheating occurred. The graders overstated the solvers' scores. The authors (correctly, I believe) interpreted these results as a confirmation of equity theory. The initial lottery violated an implicit norm that all experimental participants should be paid equally. Equity was restored by taking money away from the “rich” or giving more money to the “poor.”

This study is less relevant to the consequences of income inequality than the plagiarism study, since the inequity resulted from a specific event (the lottery) and the cheating was intended to hurt or help a specific person (the beneficiary or the victim). While it is important that specific inequities be corrected, I believe income inequality results in a more general dishonesty in which the beneficiary is oneself, there is no specific intended victim, and the victims are always hurt. Examples would include cheating on your income tax, burying hidden charges in contracts (“gotcha!”), or lying in political advertisements. After 40 years as a college teacher, I'm well aware of how internet plagiarism has eroded the quality of campus life. Would there be less of it if college students graduated with less debt and were more confident they could get a good job after graduation?

Thursday, March 15, 2012

Occupy the Tax Code

There is a substantial literature in social psychology relating both income and income inequality to happiness. In summary:
  • Relative income is important. In all societies, there is a positive association between personal income and happiness. That is, the rich are happier than the poor.
  • When comparing relatively affluent countries, the most important variable affecting happiness at the societal level is income inequality. The greater the difference in income between the rich and the poor, the less happy the people in that society are.
In view of the importance of inequality and its relevance to the Occupy Movement, I'm going to post a series of articles summarizing this research and its implications, probably beginning next week. However, the current post is about a new study looking at one of the ways to reduce inequality—progressive taxation.

First, let's be clear about terms.
  • A progressive tax system is one in which as income goes up, the tax rate increases. Our income taxes are, in theory, progressive. The rate varies from 15% to 35%. However, the fact that capital gains are taxed at a lower rate than other income and the existence of various loopholes make the system less progressive than it otherwise would be.
  • A regressive tax is one in which the poor pay a higher tax rate than the rich. Sales taxes are regressive, since low income people spend a higher percentage of their income.
  • A flat tax is one in which everyone pays the same rate. Everyone enrolled in Medicare pays the same rate (1.45%) regardless of their income.
One way to reduce income inequality is through progressive taxation. The rich are taxed at a higher rate, and some of that money is redistributed either in the form of direct payments to the poor (welfare), or through public goods such as education, health care, or public transportation. Oishi, Schimmack and Diener looked at the effect that progressive taxation has on the general level of happiness among countries. Since they were looking only at progressive taxation, they statistically eliminated the effects of average income, income inequality, the average tax rate, and government spending. (In case you are wondering, average income is positively related to happiness, inequality is negatively related, and both the average tax rate and government spending are mostly unrelated.)

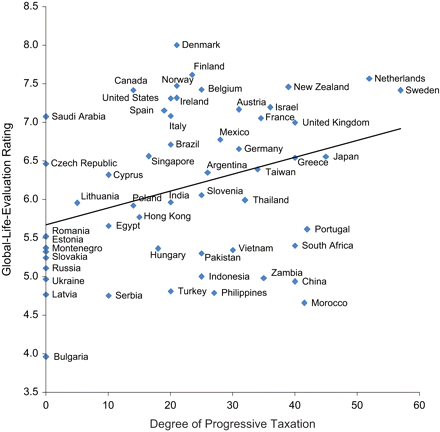
Happiness data were collected from 54 countries by the 2007 Gallup World Poll. It was measured in three ways. Global life evaluation asked people to rate their life on a 10-point scale from worst to best possible life. Positive life experiences refers to the average answer to ten questions about yesterday, such as whether the participants smiled or laughed a lot, or were treated with respect. Negative life experiences is the average answer to seven questions about whether they experienced negative emotions, such as sadness or anger, yesterday. The results were fairly consistent regardless of which way happiness was measured.

Degree of progressive taxation was defined at the difference between the highest and lowest tax rates in the country. (They calculated some other more complex indexes of progressivity, but the results were the same.) As predicted, the more progressive the tax system, the greater the happiness of citizens. Depending on which measure of happiness is used, progressivity accounted for between 24% and 52% of the variation in happiness. Here is a chart showing the scatterplot with the countries labeled.


You will notice that the United States has one of the less progressive tax codes among the 54 countries. Our happiness is a bit higher than would be predicted on the basis of the overall data (as indicated by the best fit straight line). That's probably due to our higher per capita income.

The authors were also interested in why progressive taxation was related to happiness. They predicted that the effect was due to people's satisfaction with the “public and common goods” progressive taxation allows the country to provide for its citizens. Participants were asked to rate their satisfaction with seven public goods: public transportation, health care, education, housing, roads and highways, air quality, and water quality. As expected, the relationship between progressive taxation and happiness was mediated by satisfaction with public goods. That is, progressivity predicts satisfaction with public goods, and satisfaction with public goods predicts happiness. (See my earlier post on IQ and conservatism for an explanation of how mediational hypotheses are tested.)

The authors did many other analyses, too numerous to mention here. One that I found interesting was that the positive relationship between personal income and happiness was greater in countries with less progressive tax systems. That is, in a country with a less progressive tax system, like the U. S., the rich are quite a bit happier than the poor. If the tax code is more progressive, the difference in happiness between the rich and poor is not as great.

It is important to remember that these data are correlational, so we can't say that progressive taxation causes happiness. The authors note that it is possible that some variable they did not measure, such as the general level of cohesion in the society, is the cause of both progressive taxation and happiness.

This is the kind of study that I want to shout about from the rooftops. Unfortunately, the corporate media almost never report studies like this. Maybe they think they're too complicated. A more likely explanation is that the results don't support the political agenda of their owners. (Here's one exception I found. The author adopts a skeptical tone.)

All four of the remaining presidential candidates in the Elephant Party have submitted tax proposals that call for making the tax code less progressive than it is now by either replacing our current income tax system with one that is more flat, by reducing or eliminating the tax on capital gains, or both. If President Obama sticks with his plan to repeal the Bush tax cuts for people making $250,000 or more, that would make our tax code more progressive.